What we are
A managed account relationship
- Fully managed and automated
- Separately managed accounts
- Your own cash or IRA account
- 2% annual management fee
- $25K minimum account size
- You may cancel at any time

Lyman Wealth · Quantelligent® Investing
Lyman Wealth manages automated, aggressive investment strategies in separately managed brokerage accounts. Your broker account remains yours; our role is to manage the investing.
For investors who can tolerate substantial volatility and amplified drawdowns.
How the relationship works
Lyman Wealth is an investment adviser managing individual brokerage accounts. It is not a pooled fund, a trading signal service, or a place where clients hand over custody of their money.
What we are
What we are not
Suitability must be determined before investing. Lyman Wealth’s strategy is not appropriate for everyone.
The investment approach
Quantelligent® is an innovative blend of Dollar Cost Averaging and Value Averaging designed to capture and compound index volatility—endeavoring for continuous buy-low, sell-high behavior without timing the market.
The strategy uses leveraged exchange-traded funds. That leverage can magnify gains, but it can also magnify losses and extend recovery periods.
Read the complete investment philosophyMillions of historical permutations are back-tested, then visualized to identify parameters used in the strategy.
Positions are monitored and adjusted each day through software designed for consistent, rules-based execution.
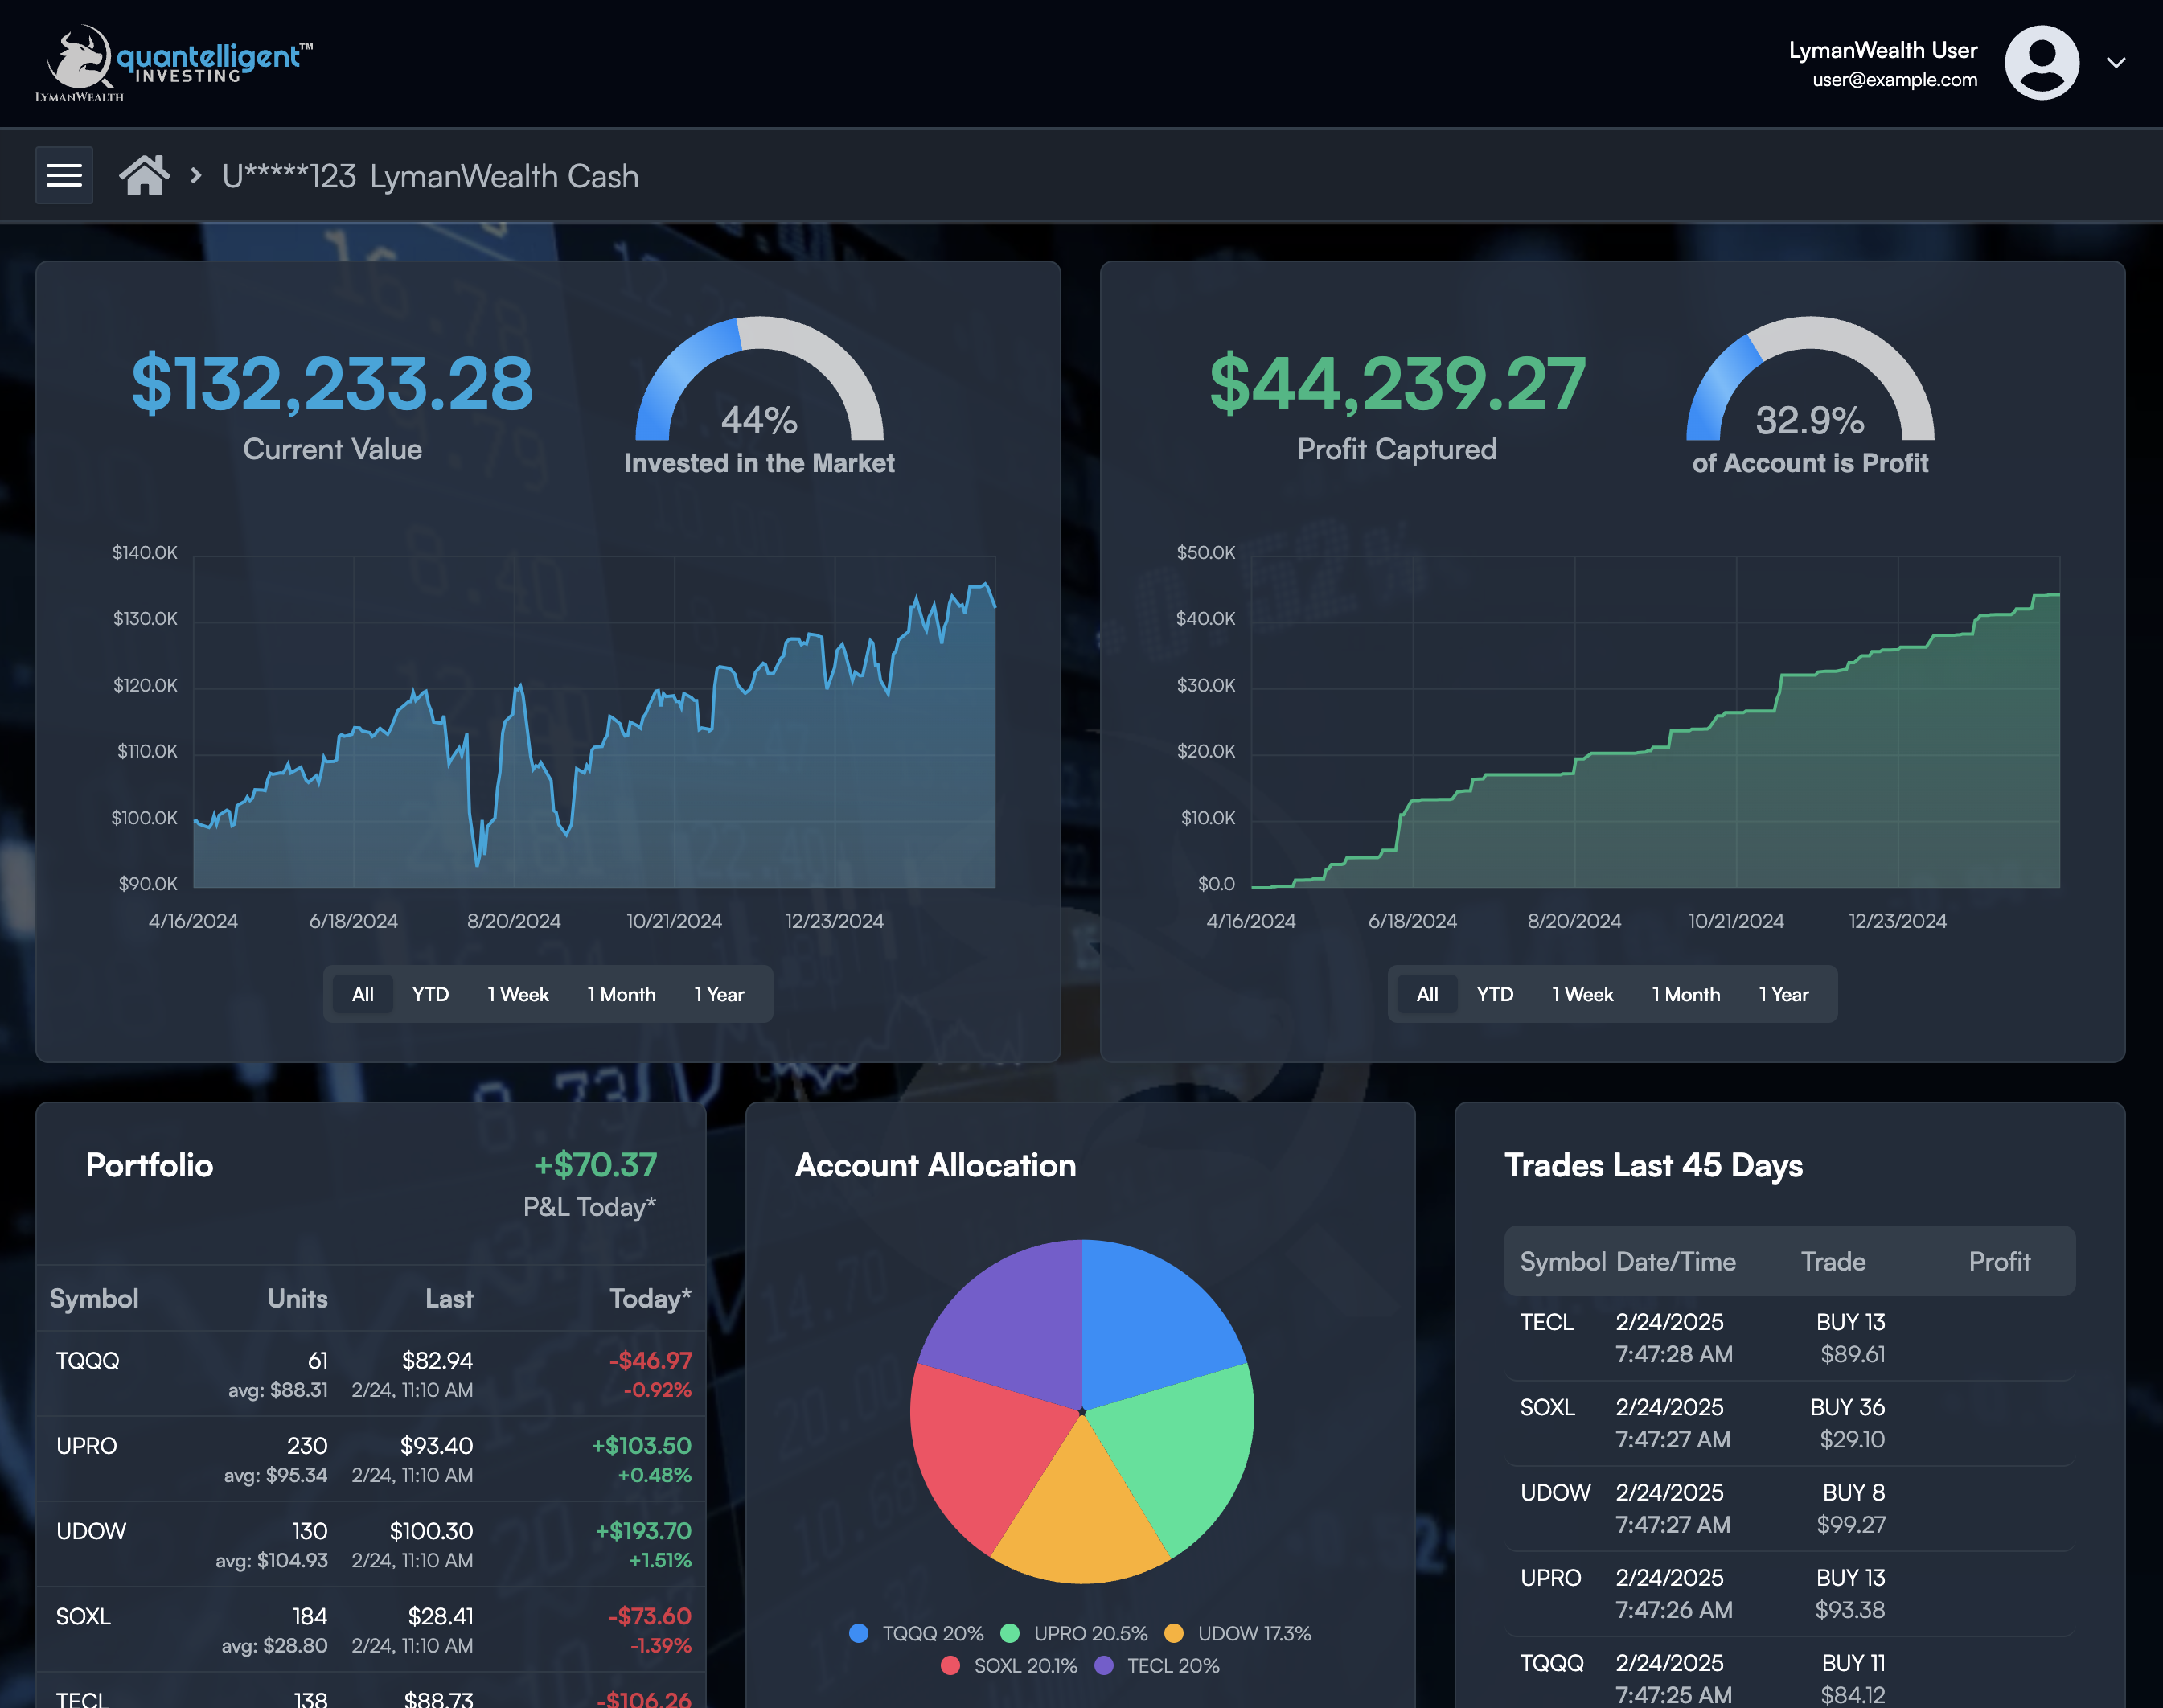
Clients can review performance, real-time updates, and analytics in the Lyman Wealth client portal.
Visibility after onboarding
The Lyman Wealth portal adds real-time updates, performance information, and detailed analytics. Clients can also sign in to their broker account to corroborate the data.
How to get started
An introductory conversation should establish suitability, risk tolerance, and whether this strategy belongs in your broader portfolio.
Read the Form ADV, client brochure, methodology, and historical results.
The account remains in your name as a cash or IRA brokerage account.
Lyman Wealth then manages the agreed investment strategy.
Investment results
Explore consolidated net returns, benchmark comparisons, and the reports behind the results.
| Period | Lyman Wealth | S&P 500 benchmark | Source |
|---|---|---|---|
| 2021* | 36.6% | 13.9% | Report |
| 2022 | -67.8% | -19.4% | Report |
| 2023 | 154.5% | 24.2% | Report |
| 2024 | 65.6% | 23.3% | Report |
| 2025 | 40.6% | 16.4% | Report |
| 2026 YTD** | 31.9% | 12.9% | — |
| Annualized** | 26.4% | 12.1% | — |
* Starting 4/19/2021. ** As of 8/28/2026. Net returns are after fees, dividends, and interest.
Annual returns include only accounts open before the beginning of the year, except in 2021. Results are not guaranteed, and past performance does not indicate future results. Modeled performance is hypothetical and does not represent actual client experience. Leveraged ETFs involve substantial risk and can amplify losses. This strategy is intended only for a small portion of a portfolio designated for aggressive growth.
A measured next step